Page header image
October 19, 2020: Learn how to make complex images accessible in Canvas - Option 1
Accessibility Goal of the Week
In the preceding three weeks, we've learned about adding alternative text (alt text) to an image in Canvas. The recommendation was to keep your alt text to 1-2 sentences. In fact, the Canvas Accessibility Checker tool will flag alt text that is more than 120 characters.
But what about images that require more than 120 characters for a suitable description? Graphs, charts, and maps are just a few examples of images that may need further textual detail. This week and next, we will outline options for how to make complex images accessible in Canvas.
Option 1: Make the content fully understood without having to see the image
This option turns the concept of alt text on its head, in a way. Students learn in a variety of ways, and having both a textual and visual representation of an image can provide all learners the information in a way that works for them. Consider the following example from a fictional course discussing social media usage:
The following graph shows data from a survey which asked Wikipedia editors why they currently edit or previously edited Wikipedia. Although the answer choices available mainly centered around themes of freedom of information, collaboration, and the need for accuracy, the vast majority of respondents replied "other". This suggests that people's reasons for editing Wikipedia do not fit these themes and that more research is needed to assess their motivations.
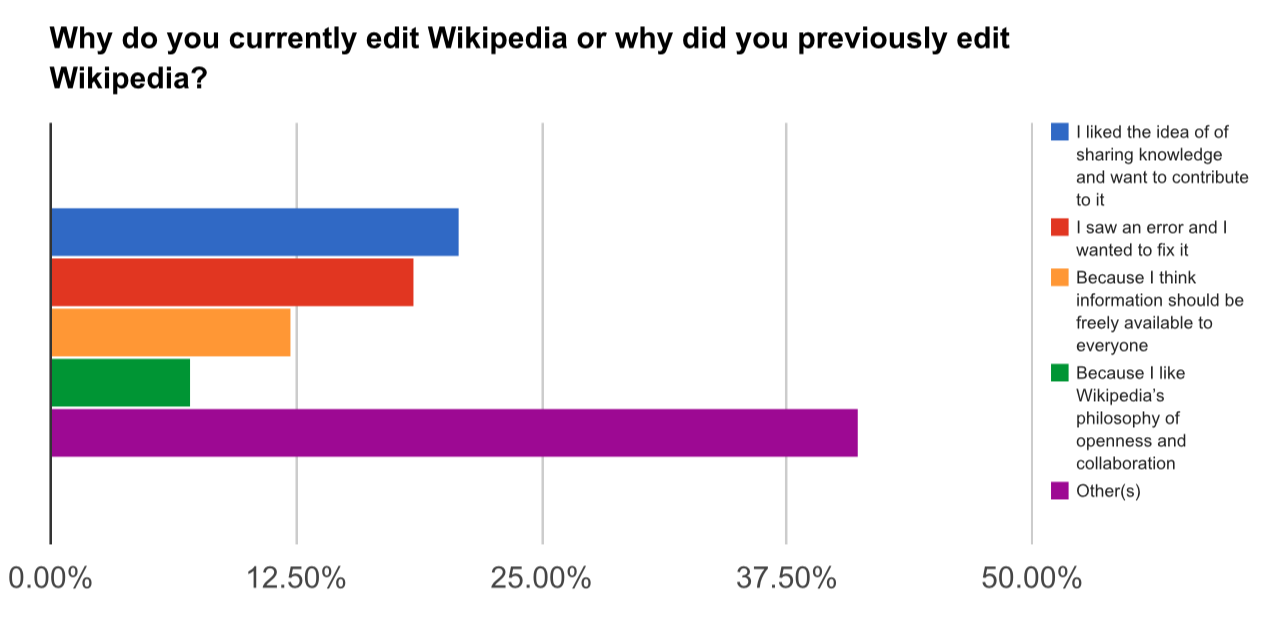
Did you notice how the description paragraph did not outline every percentage and reasons the survey respondents gave? Remember, it's not necessary to articulate every single detail in the image. Focus only on the information needed to understand the learning objective. In this case, the instructor decided the key concepts they wanted the students to take away did not require knowing the specific percentages and reasons verbatim.
If that same instructor decided they did in fact wish to convey the graph's full data textually, creating a table is another way to present the information along with the image. Tables are fully accessible for screen-reading software if formatted with row and column headers. For example:
| Reason | Percentage (in approximations) |
|---|---|
| I like the idea of sharing knowledge and want to contribute to it. | 20% |
| I saw an error and want to fix it. | 18% |
| Because I think information should be freely available to everyone. | 11% |
| Because I like Wikipedia's philosophy of openness and collaboration. | 6% |
| Other(s) | 40% |
NOTE: Even with a textual description or table, the image should still contain alt text
so screen-reading software can detect the image, but can be as simple as "[Chart]
is described thoroughly in the preceding [text/table]".